The problem
Universities make curriculum decisions, such as which subjects to require, recommend, or sequence, with little evidence about how those choices affect students. At the same time, students who are falling behind are often identified too late to help.
What I did
- Analyzed historical records of every course in the university, more than 7 million student enrollments, to study how subject choices relate to academic performance.
- Built early-warning models (random forests and logistic regression) to identify at-risk students, and designed feedback interventions to support them.
- Designed a curriculum analytics dashboard in R Shiny so faculty could explore program-level patterns themselves.
What I found
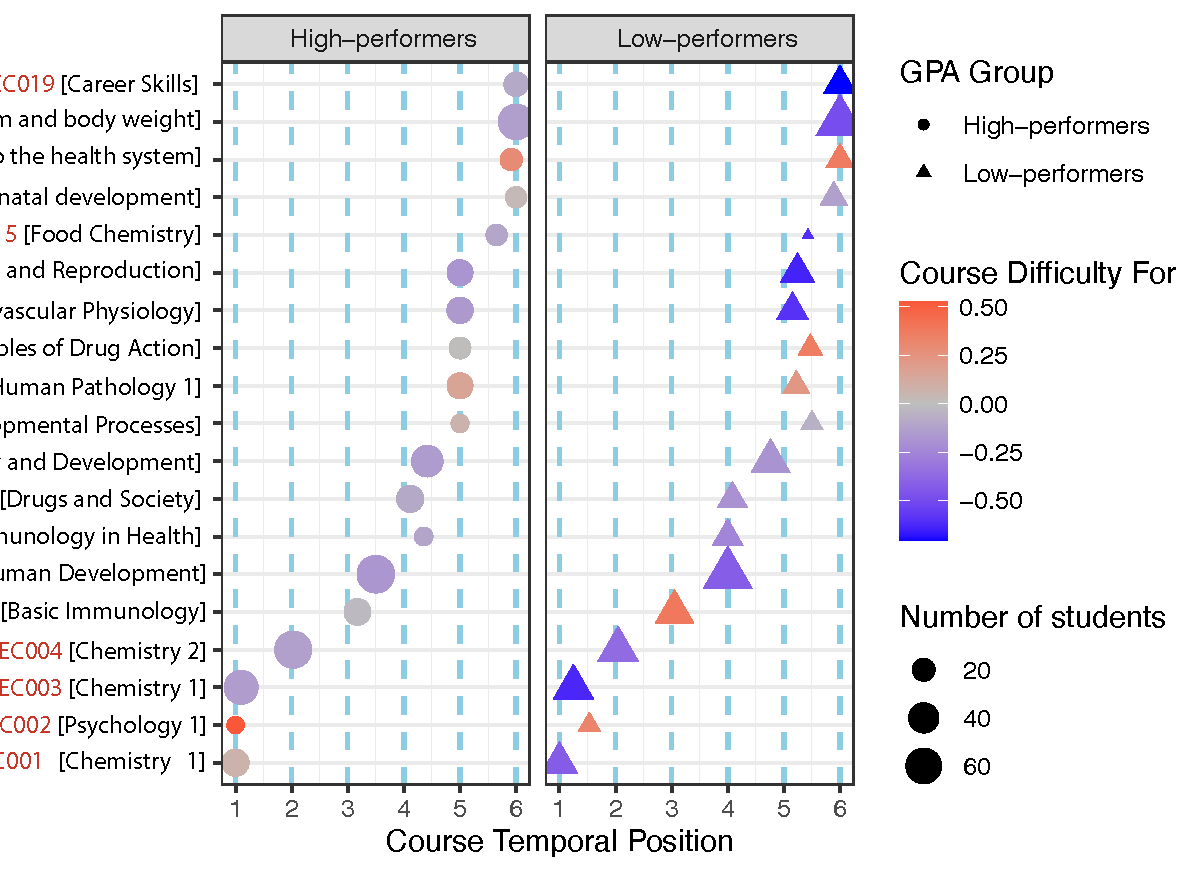
The courses students chose, and when they took them, were linked to their academic performance, which pointed to specific pathways and bottleneck courses worth redesigning.
Why it matters
The Faculty of Information Technology adopted the recommendations from this work to improve its teaching practices. It showed how institutional data, used carefully, can move curriculum decisions from intuition to evidence.
Publications
- Curriculum analytics of course choices: Links with academic performance. Journal of Learning Analytics, 2024